
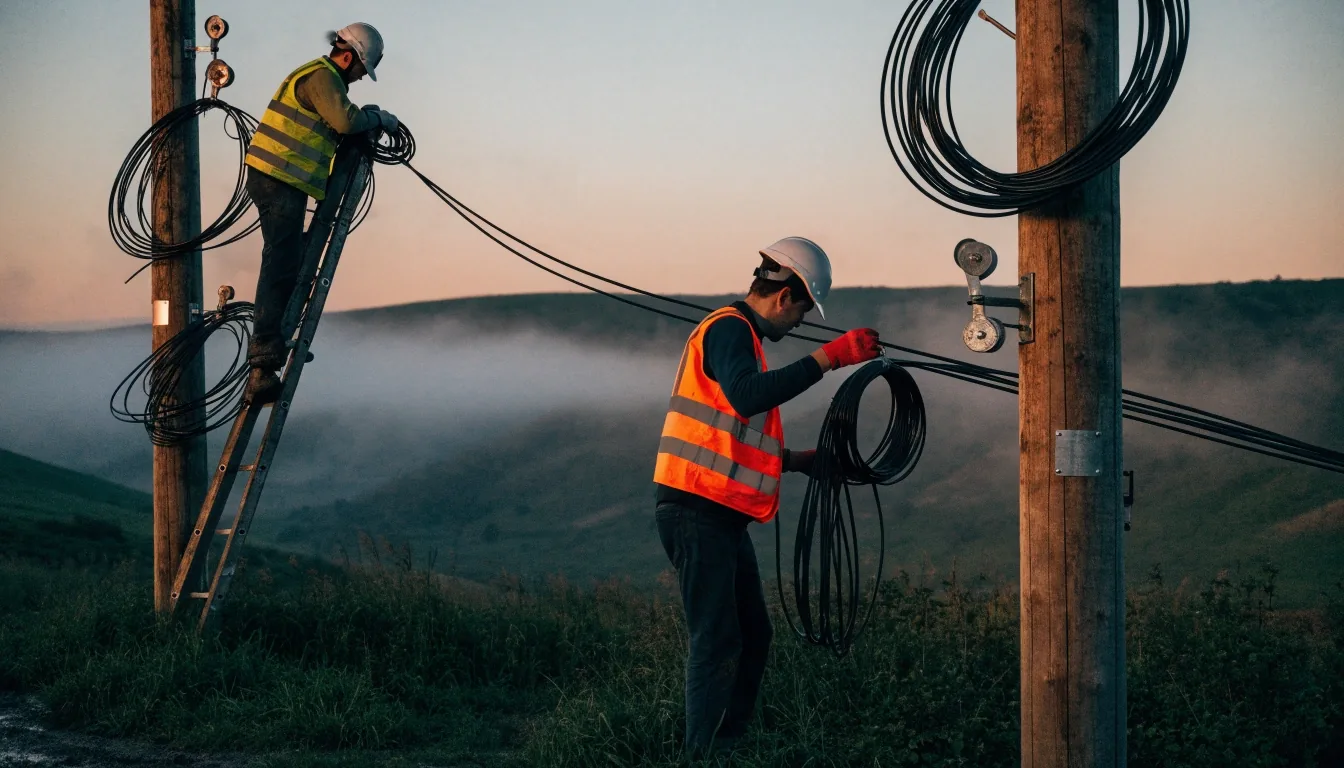



Aerial fibre trunk cable between utility poles on a fogged hillside at dusk, with a single lit window on the ridge

Tech desk

Internet technology, from cables to speed checks

Tech coverage here is about the machinery between your router and whatever you are trying to reach: the tools used to diagnose a connection, the subsea cables that carry most intercontinental traffic, and the engineering choices that decide whether a plan delivers what it advertises. We skip product announcements unless they change how the network behaves.

What we follow, and what we leave alone

A reader wrote in asking why a provider's own dashboard shows a bigger number than the speed test they ran themselves. That question sits at the middle of this desk's beat. Providers measure to the edge of their own network with their own servers; a neutral tool measures the whole trip. Both numbers are real, they answer different questions, and knowing which one you are looking at prevents most arguments with a support line.

Speed-check tools
Which tools report download, upload and latency, which add jitter, and where each one tends to run generous or pessimistic.
Cable routes
Where intercontinental traffic physically travels, how concentrated those corridors are, and what happens when one is disrupted.
Access engineering
The chain from advertised tier to your device, including Wi-Fi, in-home wiring, and how many devices are awake at once.
Device and spectrum rules
Regulatory decisions on equipment testing and satellite service, reported when they touch hardware people already own.

What we leave alone: launch events, app redesigns, and press releases that describe a marketing tier without changing how packets move. If it does not alter the network or the number on your screen, it is not a tech story here.

The number that matters

Download speed gets the attention. Latency is what makes a video call collapse.

Before the longer chapters below, hold onto one distinction: bandwidth describes how much can flow, latency describes how long the round trip takes. Most everyday frustration on a connection is a latency problem wearing a bandwidth costume.

Rural valley road at dusk with utility poles carrying cable, receding into low fog

Vermont's speed-check tool and what it collects

The Vermont Community Broadband Board launched VT Speed Check on October 6, 2026. Residents run a test, and the results feed an aggregated coverage map that officials say will help identify areas needing stronger internet service support.

Aggregation is the important word. Individual readings are useful to the person testing, while the pattern across thousands of tests is what tells a state where the gaps are. A single household measuring 40 Mbps tells you almost nothing; four hundred households in the same valley measuring the same thing tells you where to run fibre.

How the readings travel

  1. 1. A resident opens the state tool in a browser and runs a test on the connection as it normally sits.
  2. 2. The result records download, upload and latency against the tool's own measurement servers.
  3. 3. Anonymised figures roll into a district-level view rather than a street address.
  4. 4. Planners read the pattern to decide where support money is likely to do the most good.

The state gets a map. You get a number you can bring to your provider's support line, which is a different and more useful thing than a complaint without evidence.

Why a public tool beats a private one

Provider-run tests are not dishonest by default, but they are optimized for the provider's network path and often for the provider's marketing. A neutral public tool lets a state, a county, or a researcher compare results across carriers using the same method.

The tradeoff is honest and worth stating plainly: a public tool cannot see inside your network, so it reports what arrived rather than why it arrived slowly. That is a diagnostic limit, not a flaw in the method.

Browse the Tech section

Provider-run test

  • Measures the path the provider controls end to end.
  • Server placement follows the provider's own network.
  • Useful for confirming the access link is up.
  • Hard to compare against a rival carrier's result.

Neutral public test

  • Same method applied across competing carriers.
  • Results aggregate into a regional picture.
  • Cannot inspect your Wi-Fi or in-home wiring.
  • Reports what arrived, not the cause of a slow result.

Neither column wins outright. If you are arguing with your provider about the access link, their number is relevant. If you are comparing two carriers before you move, only the neutral method gets you a fair read.

Armoured subsea cable rising from dark water onto a concrete landing ramp at dusk

The Red Sea and the fragility of the cable map

More than 90 percent of data capacity between Europe and Asia runs through cables under the Red Sea, and that concentration has become a problem. Google, Meta, and Microsoft are reported to be securing backup land routes as the risk rises.

Subsea corridors

Highest capacity per cable, lowest cost per bit, but everything in a corridor shares the same geographic risk. One anchor drag or one dredging accident can take out several systems at once.

Overland routes

Land routes carry less and cost more per bit, and they cross borders, which adds permitting, latency and points of failure. They are a detour, not a replacement for the main corridor.

What it means at home

For a household connection, a disrupted corridor usually shows up as a sluggish route to a service hosted on the far side of it. Your local access link is unchanged; the middle of the trip is not.

What latency reveals that bandwidth hides

Download speed gets all the attention, but latency is what makes a video call feel broken. It is measured in milliseconds, and it is dominated by distance and by how many networks your traffic crosses.

That is why a satellite link can post a respectable download number and still frustrate anyone on a conference call, and why a land route through several countries can be slower than a shorter subsea path. Every hop adds a little delay, and the delays stack.

A quick way to tell them apart

If a page loads slowly but a large file downloads quickly once it starts, you are looking at latency. If a large file crawls while small pages feel instant, you are looking at bandwidth or contention. Run a speed test twice, once with other devices idle and once during normal evening use, and compare: the gap between the two readings is usually the honest number for your household.

Understand your results
A living room at night lit by one lamp, with an empty chair by the window and cabling running toward an unseen corner
Most slow results are measured in a room like this one, not in a lab. Wi-Fi, wall materials and furniture all sit between the router and the device running the test.

The engineering behind advertised tiers

Providers sell tiers, and tiers are engineering promises about capacity at the access point, not guarantees about what reaches your device. Wi-Fi, in-home wiring, and the number of active devices all sit between the advertised number and the measured one. Understanding that chain is the difference between filing a complaint that goes nowhere and one that gets a technician dispatched.

  1. The advertised tier A committed capacity figure at the access point. It describes the pipe your provider is responsible for up to the wall of the building.
  2. The line into the home Coax, copper or fibre, plus whatever joining hardware sits in the basement or hallway. Age and condition here quietly set a ceiling.
  3. In-home wiring Splitters, old extension jacks and long runs inside walls cost throughput that the provider never promised in the first place.
  4. Wi-Fi in the room Distance from the router, walls, and neighbouring networks on the same channel all matter. Two rooms away is a different connection than beside the router.
  5. The device itself Older laptops and phones cap out below the tier they are attached to. Testing on the oldest device in the house is a good way to rule this out.

A complaint that names the step you eliminated gets treated seriously. A complaint that says only that the internet is slow usually gets a script read back to you.

Certification and the device on your shelf

Regulatory work on device testing looks distant until a router or a phone you own is affected. The FCC's planned October 29, 2026 vote on barring Chinese labs from testing devices sold in the U.S. would change which facilities can certify equipment for sale, and the proposal also reaches certification bodies in countries that do not offer reciprocal treatment to American labs.

The practical side of this for a household is simpler than the policy language. Every radio device sold in the country goes through a testing facility before it reaches a shelf. Move the list of accepted facilities and you move the path a device takes to market, which can affect how quickly new hardware arrives and which brands bring it.

Read the full report


Satellite links entering the consumer stack

Direct-to-device service is moving from demonstration to product. The FCC approved SpaceX to launch and operate 15,000 satellites for Starlink Mobile, with a waiver easing the path to satellite wireless service without a spectrum-leasing deal with a terrestrial carrier.

For consumers, the practical question is when a handset in a coverage gap becomes a handset with a signal. Satellite links post workable download figures and comparatively high latency, which is fine for a message and awkward for a call.

Read the full report
Network wall jack and a small dark router on a hallway skirting board at night with cables coiled beside it

Testing tools compared honestly

We do not run a speed test ourselves, and we say so. What we do is explain which tools report download, upload, and latency, which report jitter, and where each one tends to be pessimistic or generous. If a tool refuses to disclose its server locations, treat the number with more caution than one that does.

Download and upload

The headline pair. Reliable across most tools because both ends can count the bytes that arrived, but sensitive to what else is using the connection during the test.

Latency

The round trip to the test server. Compare this number between tools only when the server cities are comparable, otherwise you are measuring geography.

Jitter

How much the latency wanders during the test. Plenty of tools skip it entirely, and it is often the number that explains a choppy call better than raw speed does.

Server disclosure

A tool that tells you where the far end sits lets you judge the result. A tool that hides it may be routing your test through a flattering path without saying so.

Questions readers send this desk

The same handful of questions arrives most weeks. These are the short answers; the longer ones live in the guides.

Talk to the desk

Have a question this page does not cover? Call +12064389529 Monday to Friday, 9:00 AM – 6:00 PM, or write to JesseGonzalez@lonnardjames.com.

Reach the newsroom

Why does my provider's tool show a higher number than a public speed test?

Provider tools usually test to a server inside their own network, which measures the access link and very little else. A public tool routes further out, so its number includes the trip beyond your provider's boundary. Both are honest measurements of different things.

Should I run a speed test on Wi-Fi or plugged in?

Run both if you can. The wired result tells you what arrives at the building; the Wi-Fi result tells you what survives to the room you actually sit in. When the two differ sharply, the problem is inside your home rather than on the line.

Does a disrupted cable route mean my internet will go down?

Usually not, because carriers reroute traffic. What you are more likely to notice is a specific service feeling sluggish while everything else behaves normally, since the replacement path is longer and carries less.

Is a satellite connection enough for a household?

It depends on what the household does with it. Download figures from satellite links have improved a great deal, while latency remains higher than a wired path. Messages, browsing and streaming tolerate that; live calls and competitive games often do not.

How many speed test runs are worth doing?

Two or three across different times of day, not twenty in one sitting. A single result is a snapshot; a small set taken at similar moments on different days is the kind of pattern a technician can act on.

Quiet residential street at night with one warm lit window and an overhead cable crossing the frame

Where to go next

Start with a test you can trust, then read the result properly

The guide walks through what to switch off before a run, why time of day changes the answer, and how to record the results so they mean something later. The follow-up explains what each number on the screen is actually telling you, latency included.

Lonnard James Broadband Review is an independent editorial desk. We publish our standards openly and do not accept payment for coverage. Read the editorial standards.